


By Sarah Montalbano – Alaska Policy Forum
Introduction

Late October brought the release of the 2022 results of the National Assessment of Educational Progress (NAEP), also known as the Nation’s Report Card. The NAEP is a nationwide assessment that covers an array of subjects, but samples of fourth and eighth graders are tested in math, reading, and science every two years to provide a consistent benchmark across the country. The results are shocking: The U.S. averages in fourth-grade mathematics wiped out all incremental gains made since 2005, and fourth-grade reading since 1992.
Alaska experienced alarming decreases in mathematics since 2019. Fourth graders dropped six points in mathematics, and eighth graders dropped four points. Every 10 points on the NAEP represent roughly one year of learning. By that rule of thumb, Alaska’s fourth graders lost more than half a year of math learning, while eighth graders lost nearly as much.
While the Anchorage Daily News trumpets that “Alaska students stay steady in reading” since the pre-pandemic 2019 exam, reading scores are still approximately a full year of learning behind the national average, and 2.1 years behind Florida, which was third in fourth-grade reading. Only 28% of Alaska’s fourth graders were proficient in mathematics, and only 24% were proficient in reading in 2022.
Key Takeaways
— Alaska’s fourth-grade reading scores are more than a full year of learning behind the national average.
— Alaska’s fourth graders lost more than half a year of learning in mathematics since 2019 and have fallen nearly a year behind the national average.
— Three in four of Alaska’s fourth-grade students are not proficient in reading.
— Fourth-grade mathematics proficiency dropped to 28%, down five percentage points from 2019, and a higher percentage of students are demonstrating little to no mastery.
— In both reading and mathematics, Alaska’s charter school students outperformed traditional public counterparts by a significant margin; charter students perform two full years ahead of traditional students in fourth-grade reading.
Helping Alaska’s students catch up to pre-pandemic grade-level expectations will be crucial to their future achievement and Alaska’s economy. Florida, which implemented early literacy policies and has embraced competition through school choice since 2001, did not suffer declines in fourth-grade reading and ranked third nationwide. The implementation of the Alaska Reads Act, based on Florida’s successful literacy policies, will hopefully help students recover from pandemic disruptions and build a solid foundation for literacy in future years.
Students’ abilities in mathematics suffered the most, likely due to pandemic school closures and related disruptions. Helping students catch up in mathematics will require substantial remedial time, and reading cannot be deprioritized, as students who cannot read by third grade have trouble learning fourth-grade material in other subjects. Teaching students to read with science-based methods and identifying struggling students early will help students who need more-intensive intervention and those who fell behind due to pandemic school closures.
Alaska was dead-last nationwide in reading for low-income fourth graders and second-to-last for all fourth graders. Alaska’s fourth-grade reading score is the lowest it has been since 2003, the first year for which scores are available in Alaska. Any perceived narrowing of gaps between Alaska’s scores and the national average does not reflect actual improvement: It shows that U.S. averages declined severely since 2019, while Alaska declined less.
U.S. Results
The NAEP is a congressionally mandated assessment that measures the mathematics and reading skills of a sample of representative fourth and eighth graders nationwide. The NAEP is administered every two years, but the pandemic delayed the 2021 exam; therefore, declines are measured over the three years since 2019. Reporting is granularized to the national, state, and selected district level, and student performance can be broken into factors such as gender, race/ethnicity, public or nonpublic school, and teacher experience. Results are available for all 50 states, the District of Columbia, Puerto Rico, and Department of Defense (DoDEA) schools.
Scores are reported on a scale from 0 to 500 for mathematics and reading. Along with raw scores, NAEP performance is reported as the percentage of students performing at or above three achievement levels: Basic, Proficient, and Advanced. Students who fail to perform at the Basic level by showing partial mastery of national grade-level standards are designated as Below Basic.
Across the United States, not a single state reported an increase in its scores in either reading or math. Fourth-grade math saw declines in 43 states, while nine jurisdictions did not perform with significant difference from 2019. In fourth-grade reading, 30 jurisdictions saw declines, while 22 saw no significant changes. Alaska was one of the 22 states that did not change significantly in fourth-grade reading. Although Alaska is now only 12 points behind the national average, in 2022, rather than 15 points in 2019, that result reflects the three-point decline in the national average, not an improvement in reading skills in Alaska.
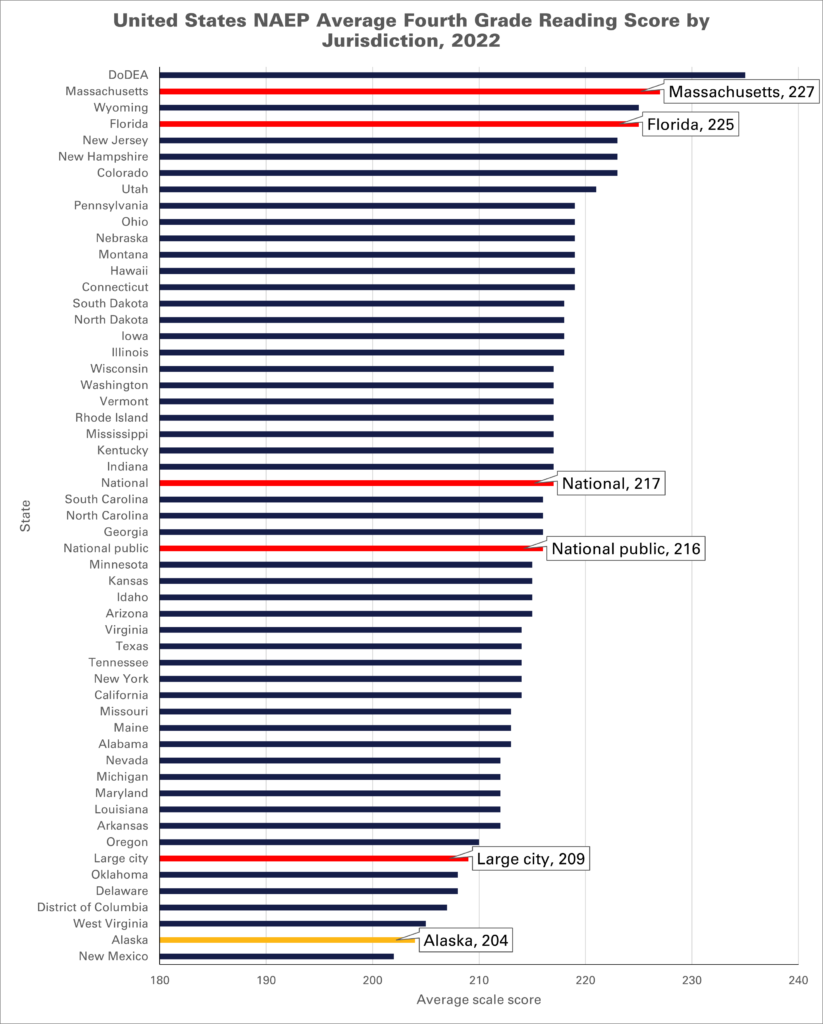
Figure 1 shows the 52 states and jurisdictions that reported fourth-grade reading scores on the 2022 NAEP exam. Alaska ranked ahead of only New Mexico in fourth-grade reading (by two points). As a state, Alaska was about half a year (five points) of reading attainment behind the average for large cities and lagged the national average and the average for public schools by more than a year.
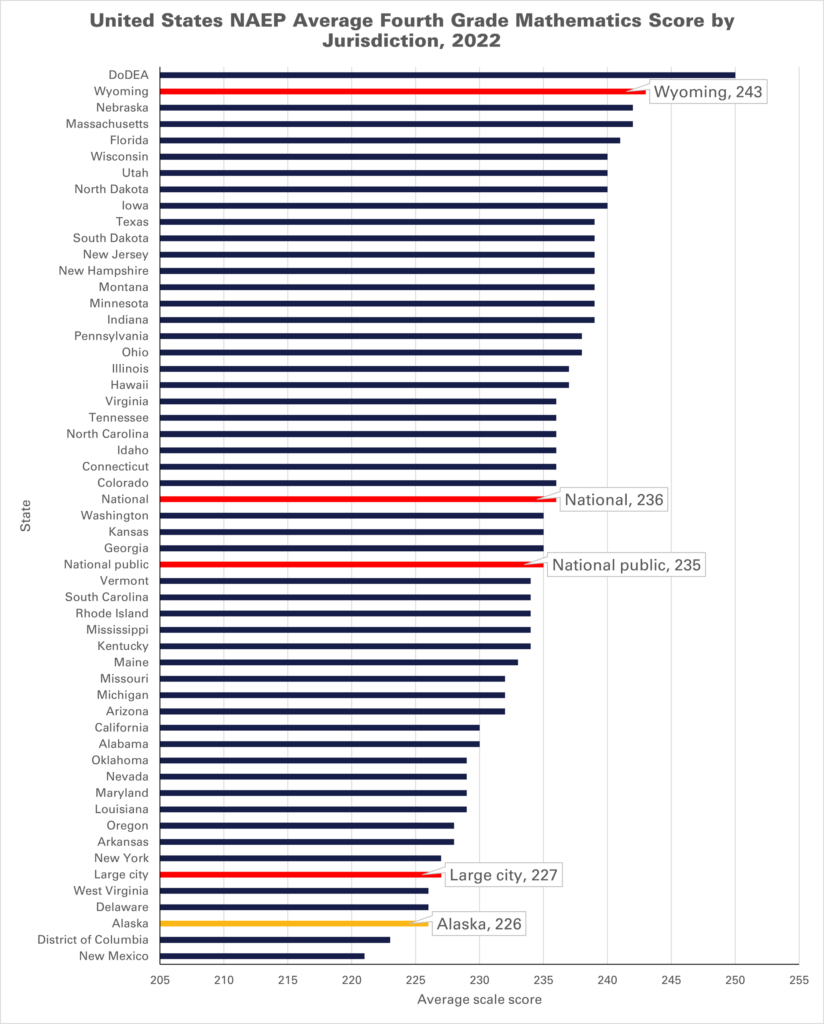
Figure 2 shows the 52 states and jurisdictions that reported fourth-grade mathematics scores on the 2022 NAEP exam. Alaska ranked ahead of only New Mexico and the District of Columbia and tied with West Virginia and Delaware. Large cities performed one point better than Alaska, and Alaska lagged almost a year behind the national average for public schools.
Nationally, states showed lower variability in their mathematics achievement than in reading, but saw an average decline of six points since 2019, and scores decreased universally across low, middle, and high-performing fourth graders. Lower-performing students declined at a greater magnitude, suggesting disproportionate harm caused by pandemic lockdowns and school closures to students already struggling with mathematics.
A greater share of students in both mathematics and reading are performing at or Below Basic compared with 2019, suggesting not only that scores decreased due to pandemic school closures, but also that closures and other school policies made the difference for some students between meeting grade-level standards and demonstrating partial or no mastery.
Dr. Beverly Purdue, former governor of North Carolina and chair of the National Assessment Governing Board, said in a recent press conference that, “We are talking about a really serious erosion of children’s capacities to read and count in the next generation of the workforce.” Not only will the U.S. workforce struggle, but Alaska’s economic competitiveness and student preparedness will suffer as long as Alaska’s children remain more than a year’s worth of learning behind the national average.
Alaska’s NAEP Scores: Reading
Alaska’s reading scores are the lowest they have been since 2003, the earliest year for which results are available in Alaska. Although Alaska’s fourth-grade reading score of 204 is only one point lower than in 2019, the state is second-to-last in the United States (with only New Mexico performing worse).
Alaska’s fourth-grade reading score was 12.28 points below the national average. Alaska’s fourth graders are almost a year and three months behind the national average in reading and about a year and six months behind the 2019 national average. Because other states declined more in reading, Alaska is only 12 points behind the national average, rather than the 2019 gap of 15 points.
Figure 3 shows Alaska’s fourth-grade reading score since 2003, in comparison with Florida and the national average. Alaska’s reading score peaked in 2007, with a score of 214, only five points below the national average that year. Since 2015, Alaska’s average reading score has declined by nine points, or almost a full year of learning. Conversely, Florida has progressed steadily to lead the nation following implementation of its early literacy initiative in 2001, and its score did not decline between 2019 and 2022. Learning how to read by third grade is crucial for long-term success, as the fourth-grade curriculum requires students to read in order to learn material in math, science, history, and other subjects.
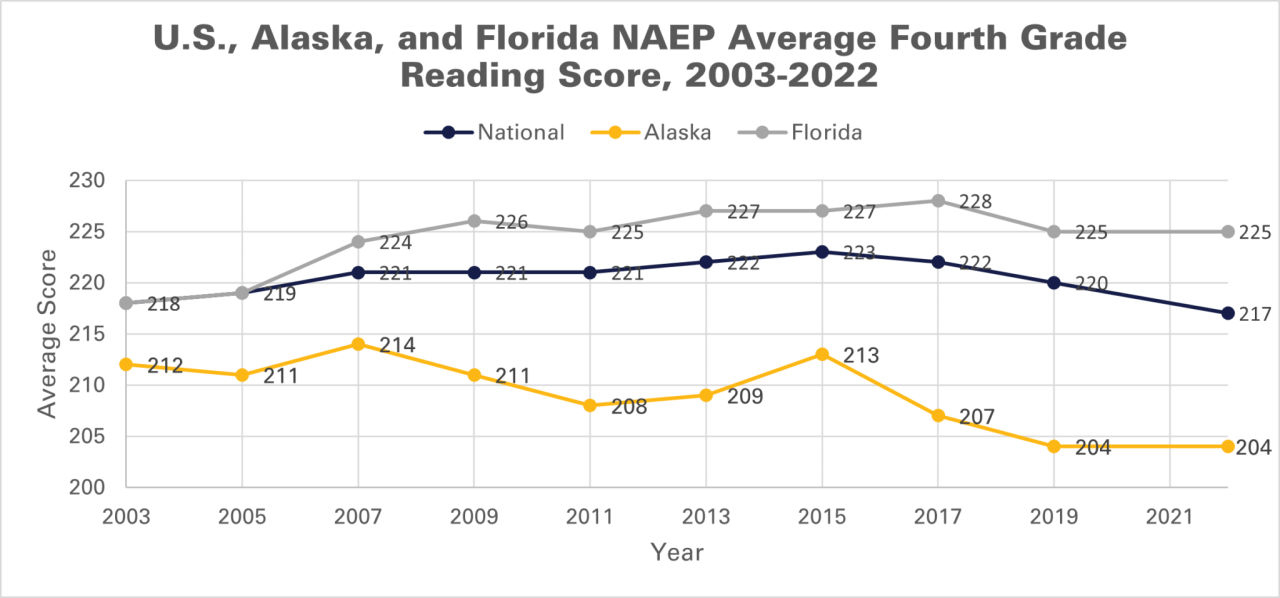
Figure 4 shows the percentage of Alaska students testing in each proficiency group in fourth-grade reading in both 2022 and 2019. The percentage of students testing Below Basic, which describes students who show little to no mastery of grade-level material, was 49% in 2022, compared with 47% Below Basic in 2019. The percentage of students testing Advanced and Proficient declined by one percentage point since 2019.
In 2022, nearly half of all Alaskan fourth graders cannot perform rudimentary reading tasks and show little ability to “determine the relevant meaning of familiar words using context,” “make a simple inference,” or “identify explicit details.” These benchmarks are applicable for the Basic level, not Proficient, which requires more understanding.
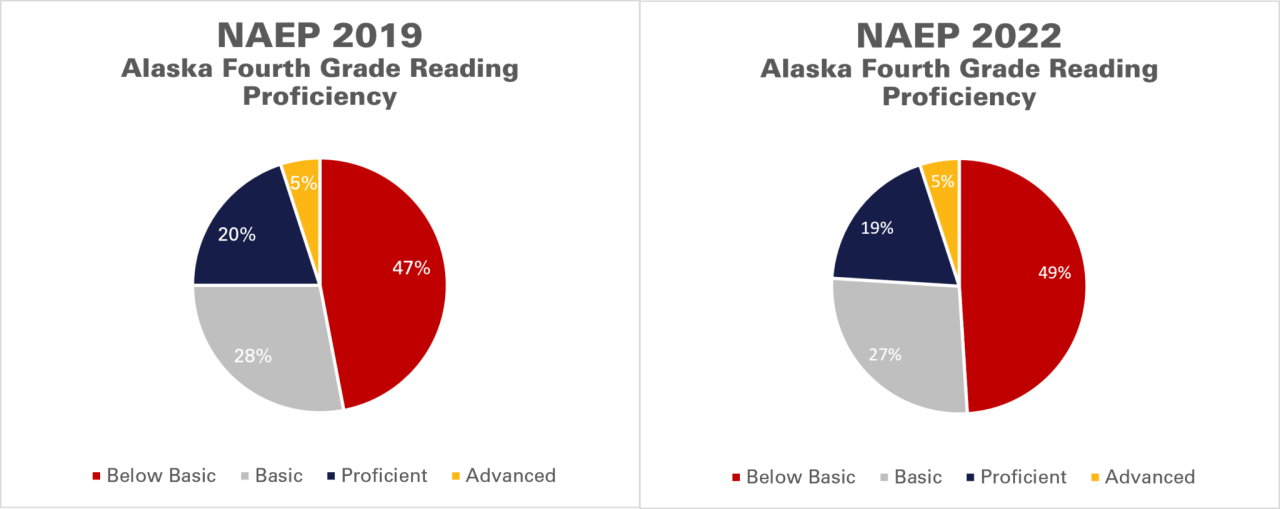
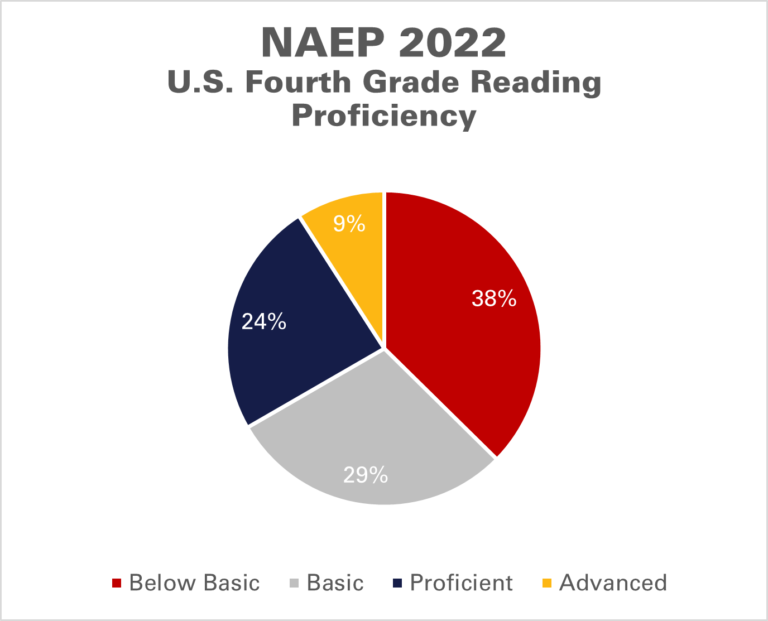
Figure 5 shows the national percentage of students in each proficiency category in 2022. Alaska’s proportion of students Below Basic is much higher than the national proportion. Across the nation, 67% of fourth graders were not proficient in reading, but 76% of Alaska’s fourth graders were not proficient. For every Alaskan fourth grader reading at grade level, three cannot.
Alaska’s average score in eighth-grade reading was 253, almost the same score received in 2019. The state was only 6.55 points below the national average in 2022 because the national average in eighth-grade reading dropped since 2019, when Alaska was 9.61 points below the national average. Alaska’s highest score in eighth-grade reading was 261 points in 2011, which was two points below the national average that year.
In 2022, 37% of Alaska’s eighth graders performed Below Basic, 37% performed at Basic, 23% were Proficient, and 3% were Advanced. In comparison, eighth graders nationally performed 30% Below Basic, 39% at basic, 27% proficient, and 4% advanced. In Alaska, 74% of eighth graders were not proficient in reading, while 69% of eighth graders nationally were not.
Alaska’s NAEP Scores: Mathematics
In fourth-grade mathematics, Alaska’s students averaged 226 points. This represented a decrease of six points from the 2019 average of 232 points, or slightly more than half a year’s worth of learning loss. No states improved in mathematics in 2022, and no matter how demographics are broken down, students either stayed flat or fell back. Alaska’s fourth-grade mathematics average was almost nine points below the national average, or almost a full year of learning behind an average U.S. fourth grader.
Figure 6 shows Alaska’s average fourth-grade mathematics score compared with the national and Florida averages from 2003 to 2022. Alaska’s highest score in fourth-grade mathematics was 237 in both 2007 and 2009, which was only slightly different from the national average of 240 those years.
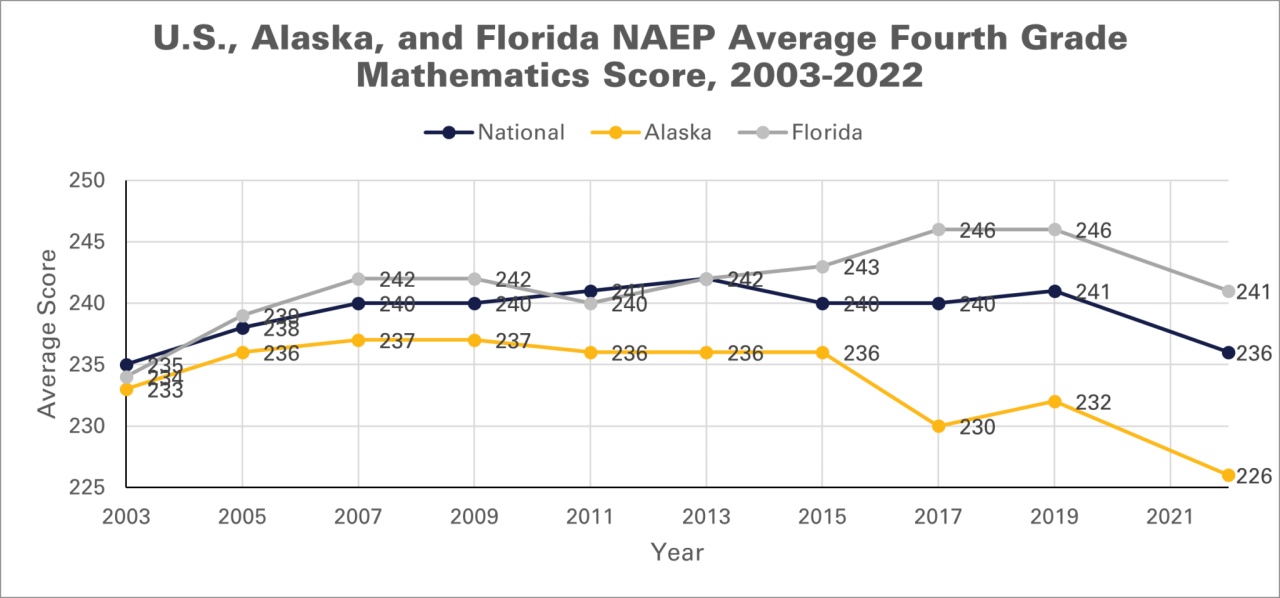
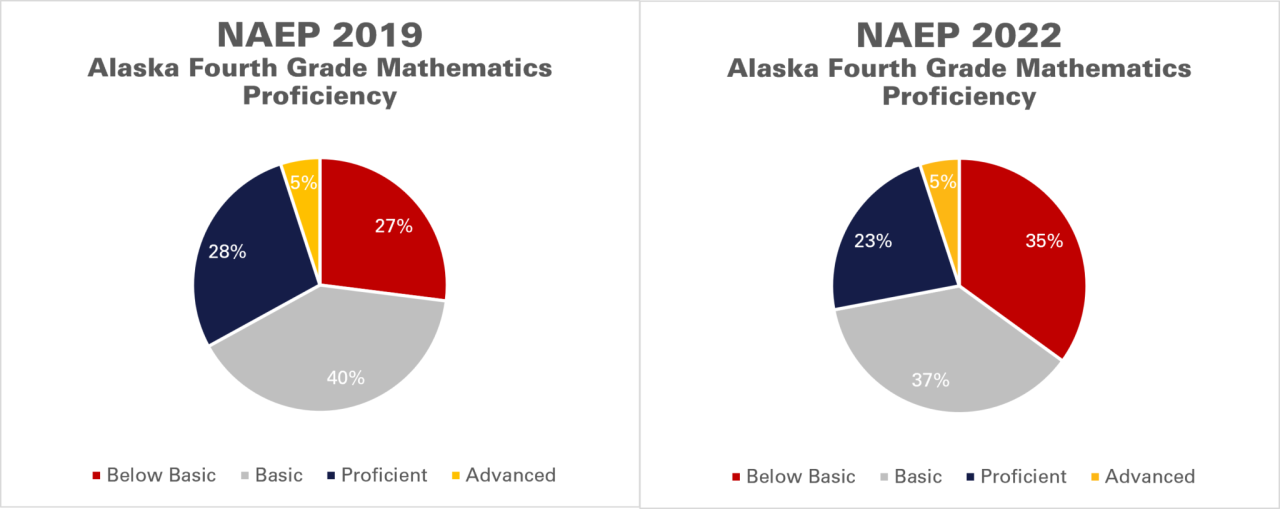
Figure 7 shows the breakdown of proficiency levels in Alaska on the 2019 and 2022 NAEP exams. In mathematics, only 23% of Alaska’s fourth graders were Proficient on the 2022 test, and about 5% were Advanced.
Most concerning is the jump in the percentage of students testing Below Basic — or demonstrating little to no mastery of grade-level material — among Alaskan fourth graders in mathematics. Although 27% of students tested in 2019 were Below Basic, 35% performed Below Basic in 2022. The percentage of students performing at the Basic level slipped from 40% in 2019 to 37% in 2022, suggesting that the learning loss was more extreme for some students. A decrease in students performing at the Proficient level implies that some students must have fallen two categories, to Below Basic. Pandemic school closures clearly interfered with teaching and learning mathematics effectively, especially for students who were already struggling.
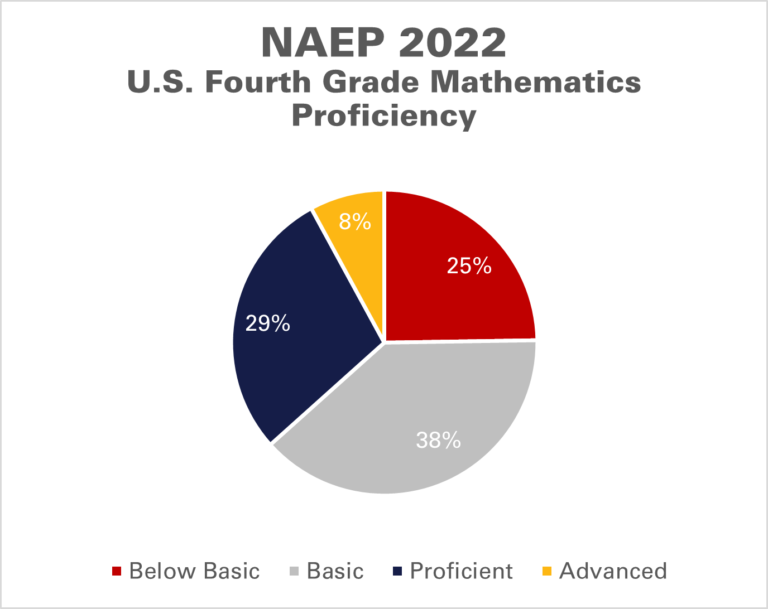
More broadly, 72% of Alaskan fourth graders were not proficient in math, much higher than the national percentage. Figure 8 shows that 63% of fourth graders nationally were not proficient. Making the picture worse, a greater portion of Alaska’s non-proficient students were at the Below Basic level rather than the Basic level.
In eighth grade, Alaska’s 2022 average was 270 points, a decrease of 4.5 points since 2019 and three points below the national average. Alaska achieved its highest score in eighth-grade mathematics in 2009 and 2011, when it was 283.
The result was worse for eighth graders in mathematics than for fourth graders. In 2022, 41% of eighth graders performed Below Basic, 36% performed at Basic, 18% were Proficient, and 5% were Advanced. In 2019, however, only 37% performed Below Basic, 34% performed at Basic, 22% were Proficient, and 7% were Advanced.
Of Alaskan eighth graders, 77% were below Proficient in mathematics, while 73% were below Proficient nationally. Looking at all U.S. students, 38% were Below Basic, 35% were Basic, 20% were Proficient, and 7% were Advanced. Note the larger proportion of students performing Below Basic in Alaska in 2022, indicating little understanding of simple mathematic operations.
Alaska’s Charter School Performance
The NAEP exam results in 2022 provide sufficient data to assess the performance of charter schools against their traditional public-school counterparts for fourth-grade reading, fourth-grade mathematics, and eighth-grade mathematics. However, data collection limitations prior to 2007 restrict comparisons to the period from 2007 to 2022.
Although nationally charter schools showed uneven performance, Alaska’s charter schools outperformed their non-charter counterparts by 16 points in fourth-grade mathematics in 2022 — more than a year and a half of learning! This gap doesn’t only result from worse performance in Alaskan public schools. In fourth-grade reading and fourth-grade mathematics, Alaska’s charter schools averaged five points, or half a year, above the national average. Among Alaskan schools, charters also have fewer nonproficient students than their non-charter peers. (Nationally, charter schools performed four points worse than non-charter schools in fourth-grade reading and mathematics.)
Figure 9 shows the time period between 2007 and 2022, with charters and non-charters separated. Since 2007, Alaska’s charters have outperformed their non-charter counterparts by between 12 points (2009) and 23 points (2019) in fourth-grade reading — ranging from a year of extra learning to more than two years. Since 2019, charter school scores declined by four points, and non-charters declined by one point, to 202 points. In 2022, Alaska’s charter schools demonstrated two full years of additional learning above their non-charter counterparts in fourth-grade reading. Indeed, Alaska’s overall average reading score of 204 is as high as it is in part because the small group of high-performing charter students raises the average.
In mathematics, charters have outperformed their non-charter counterparts by between 10 and 19 points since 2007. In 2022, charters showed more than a year and a half of progress, or 16 points, above their non-charter counterparts in fourth-grade mathematics.
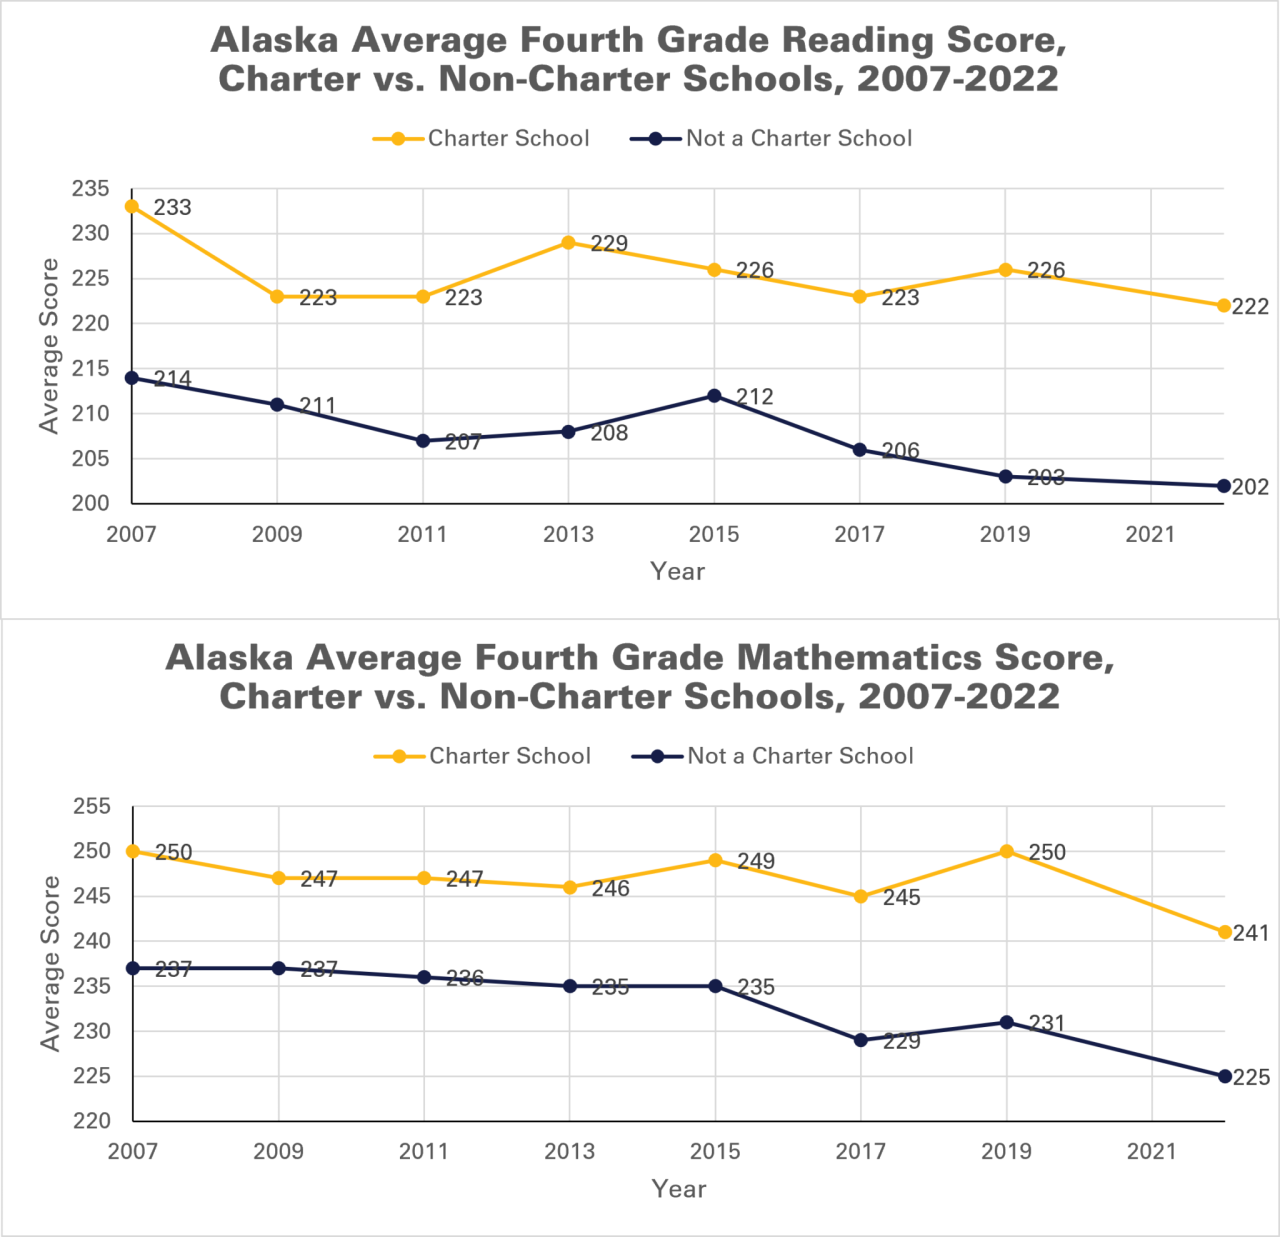
Figure 9: Alaska’s charter school performance in fourth-grade reading and fourth-grade mathematics. In 2022, Alaska’s charter schools outperformed their non-charter counterparts by 16 points in fourth-grade mathematics — more than a year and a half of learning — and 20 points, or two full years, in reading.
Figure 10 shows the proficiency breakdown of Alaska’s charter schools and non-charter schools in 2022 for fourth-grade reading. While 62% of charter-school students were not proficient (which was five percentage points lower than the national average of 67%), 76% of non-charter students were not proficient. Furthermore, charter schools left only one-third of their students performing Below Basic, while non-charter schools failed to raise one-half of their students above that level.
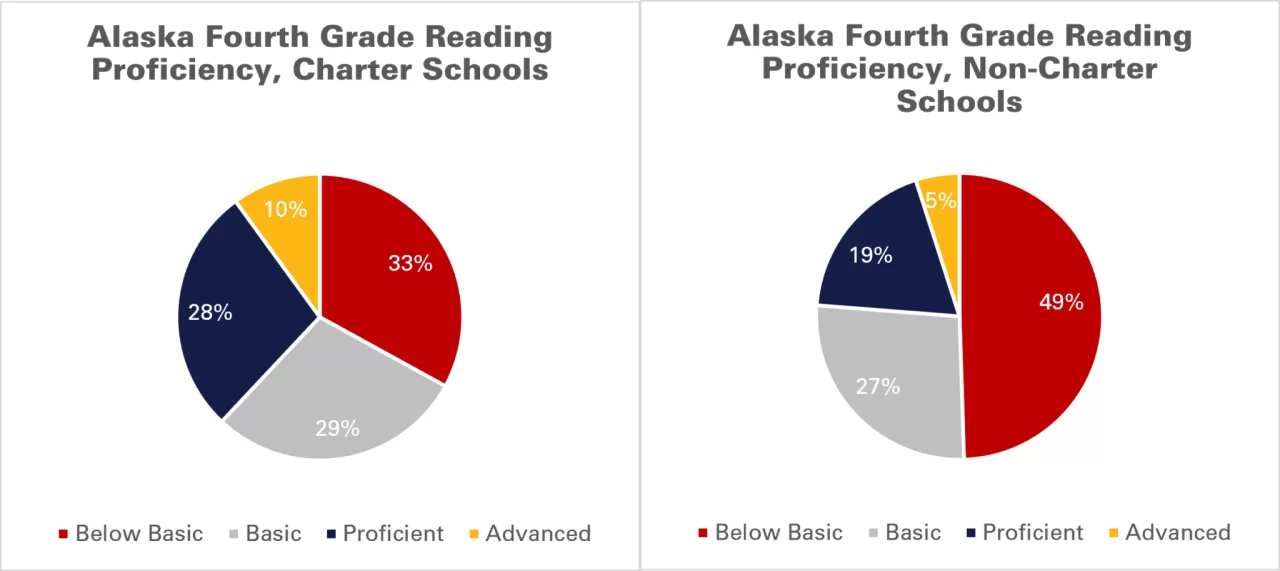
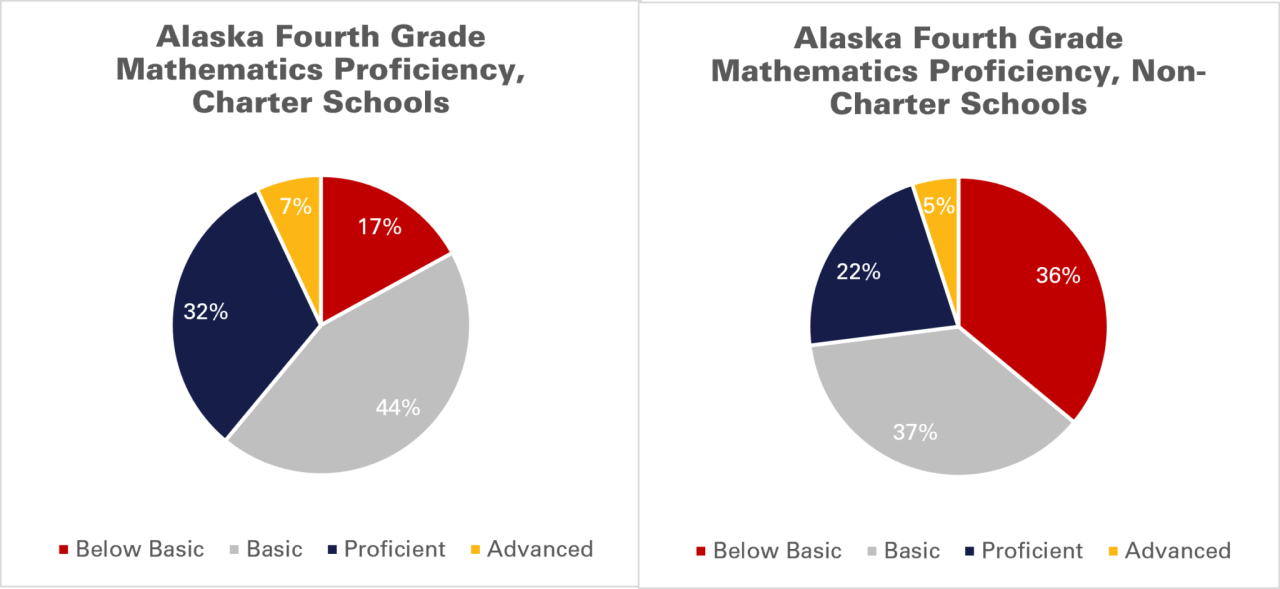
Figure 11 shows a similar situation for mathematics: 61% of fourth-grade charter students were below Proficient (two points lower than the national average), while the same was true for 73% of non-charter students. However, the division between Basic and Below Basic performance was starker for fourth-grade mathematics. While only 17% of charter students performed Below Basic, 36% of non-charter schools did so. In 2022, charter instruction made the difference between demonstrating partial mastery and preparedness for challenging work and showing no mastery of mathematics material.
Alaska’s Performance by Demographic
Unfortunately, student demographics still play a significant role in educational achievement. Aggregating results to all Alaskan students misses differences that may guide effective policy to help students with unique challenges. Aggregate numbers also gloss over demographic differences between states that might partially explain variations in average scores.
An analysis by the Wisconsin Institute for Law and Liberty (WILL) “predicted” NAEP 2022 fourth- and eighth-grade reading scores based on three demographic characteristics: the proportion of non-white students, the proportion of low-income students, and the proportion of students with disabilities. These predicted scores represent what a state would expect to receive based on the relative scores of the students in demographic groups based on each group’s performance nationally. The prediction is subtracted from the state’s actual score. A positive number shows that state policies have a relatively beneficial effect on its students, while a negative number shows that state policies have a relatively detrimental effect on its students.
WILL’s analysis found that the gap between what Alaska ought to achieve in fourth-grade reading and what the state does achieve was the worst in the nation (51st), with an actual score almost 13 points lower than the predicted score based on demographic makeup. Similarly, Alaska’s eighth-grade reading gap ranked 49th nationally, with an actual score seven points below the predicted score. Alaska’s demographic challenges are real, but Alaskan students absolutely have the potential to read better than they currently do.
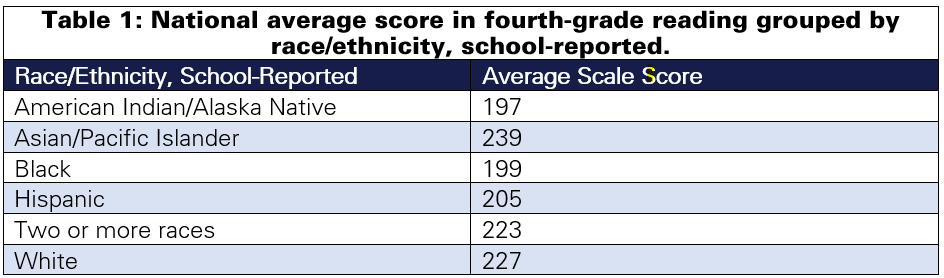
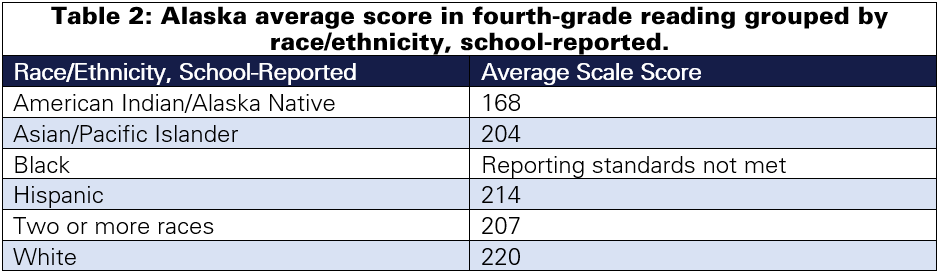
The NAEP breaks down average scores into six school-reported racial/ethnic demographics: American Indian/Alaska Native, Asian/Pacific Islander, Black, Hispanic, two or more races, and White. Table 1 (national) and Table 2 (Alaska) show the average scores for each demographic in fourth-grade reading.
Alaska’s American Indian/Alaska Native students showed the lowest average score, of 168, which was 29 points (almost three years) behind the national average for that demographic. Asian/Pacific Islander students trailed the national average for that demographic by 35 points, and students from two or more races also were behind the national average for such students by 16 points. White students in Alaska were almost nine months of learning (seven points) behind White students nationally.
On the other hand, Alaskan Hispanic students outperformed their national counterparts by nine points, or almost a full year of learning. Table 1 and Table 2 demonstrate the differing magnitudes of the pandemic’s effects on different demographic groups in Alaska, but almost all students fell behind the national averages for their respective categories, including White students. One solution that deserves attention is early literacy programming, such as policies implemented by the Alaska Reads Act, which help direct resources to the students who need the most help academically. In 2022, all demographic groups in Florida, for instance, exceed their respective national averages, no doubt in part due to its 2001 early literacy reforms.
Considering students by gender in fourth-grade reading shows that Alaska’s female students significantly outperform their male peers. Whereas the U.S. average for females is seven points higher than for males, Alaska’s female students were 13 points above Alaska’s male students. Nonetheless, Alaska’s female students remained four points below the national average for male students.
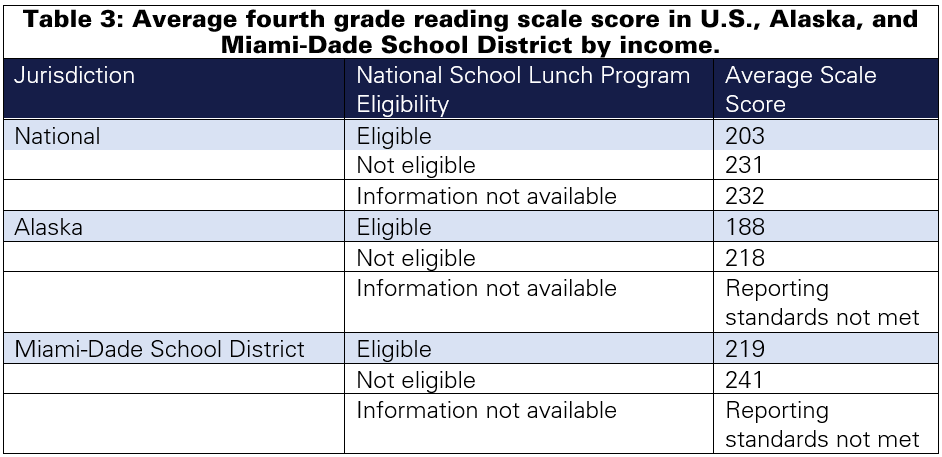
Turning to income level, eligibility for the National School Lunch Program, which provides free or reduced-price school lunches to students in need, is frequently used as a proxy to identify low-income students. Table 3 shows that, in 2022, fourth-grade students eligible for the program averaged about 203 points in reading nationally. (Recall that Alaska’s average score for all students in fourth-grade reading was 204.) Alaska’s fourth graders eligible for the program averaged 188 points, or 16 points below the average score within the state. Those students not eligible averaged 218 points in Alaska, or 14 points above the average.
Alaska’s average score in fourth-grade reading for low-income students is 51st, or dead last, in national rankings and is 15 points below the corresponding national average.
Consider Miami-Dade public schools in Florida, one of the 26 districts tested by NAEP. One-fifth, or 20%, of Miami-Dade’s fourth graders are English-language learners; 15% are students with disabilities; and 91% are Black or Hispanic. In fourth-grade reading, low-income students from Miami-Dade scored an average of 219 points — exceeding Alaska’s score for upper/middle-income students. Table 3: Average scale score in fourth-grade reading nationally, in Alaska, and in the Miami-Dade School District, based on eligibility for the National School Lunch Program, a common proxy for low-income students.
Conclusion
The national trends visible in the NAEP 2022 results, released on October 24, are alarming, and Alaska’s scores are much worse than the national averages.
Alaska’s performance in mathematics has suffered since 2019. Fourth graders dropped six points, slightly more than half a year of learning, and have fallen nearly a year behind the national average. Eighth graders dropped four points in mathematics. Only 28% of Alaska’s fourth graders achieved proficiency in mathematics, and a higher percentage of students are demonstrating little to no mastery in fundamental math concepts. Mathematics instruction deserves substantial remedial time to catch up.
Alaska was second to last in fourth-grade reading nationwide, ahead only of New Mexico. Alaska’s reading score dropped by one point, but reading scores are still a full year of learning behind the national average and 2.1 years behind Florida, which is a model for early literacy education. For every Alaskan fourth grader proficient in reading, three are not.
In both reading and mathematics, Alaska’s charter school students outperformed their traditional public counterparts in 2022, as they have done historically, although they did show several points of decline compared with 2019. In fourth-grade reading, Alaska’s charter school students were two full years ahead of their peers and a half-year ahead of the national average. In fourth-grade mathematics, Alaska’s charter school students were a year and a half ahead of their non-charter peers and a half-year ahead of the national average.
Alaska showed the greatest difference in the nation between where it is and where it ought to be based on demographics in fourth-grade reading, with a gap of almost 13 points, suggesting that Alaska’s students should be performing much better than they are. All of Alaska’s racial/ethnic groups, aside from Hispanics, performed worse than the corresponding national average, some by large margins. Low-income students in Alaska performed 15 points worse on fourth-grade reading than the relevant national average, and on a state-by-state ranking, Alaska’s low-income students performed the worst.
Helping Alaska’s students catch up to pre-pandemic grade-level expectations will be critical for the state’s economy as well as every student’s future. States with strong early literacy programs, like Florida and Mississippi, weathered pandemic disruptions much better than other states and led the nation again in reading. Implementing the Alaska Reads Act will help students recover from the pandemic by identifying and directing resources to struggling students and building a solid foundation for literacy in Alaska.


7 Comments
As a substitute teacher for 20 years, 15 with ASD, not surprised at all…except I’d have thought it’d have been worse. When students realize their are no consequences to not learning, to not even making an effort, then many don’t. Holding back students for failing to “achieve grade proficiency” or mandatory summer school for failing just English or Math are the only actions that they might understand, that might actually work & help these students… their classmates, teachers, schools, & society.
Looks to me that wanted teachers fron the northeast USA to come to Alaska to teach our kids and send our teachers up their. That way it will level the playing field. Isn’t that what liberals want so badly? I want a participation trophy now for this comment.
good data here.
Good data? But not sufficient. Fix Alaska? Let’s see a chart showing the scores by borough/district/ city/school. Then, we will truly have information for analyzing the data and deciding what to do about it. As a retired teacher, I can tell you honestly that test scores absolutely don’t tell the whole story. “It takes a village to raise/educate a child” not just a teacher!
Low vitamin D levels is one of the main reason, which is easily solved, but NO ONE is talking about it.
At the risk of sounding like sour grapes, what if these scores are indicators not so much of proficiency but of wokeness? This mainly pertains to the reading scores, but even 10 to 15 years ago, my children would get poor grades not because they failed to comprehend what they were reading, but because they rejected the politically correct agenda being pushed in the horribly-worded questions. Any question about a white male would lead the student to infer he was a) stupid b) incompetent c) unfeeling or, the correct answer, d) all of the above. Conversely, any question about a minority female always was fishing for a positive assessment (creative, innovative, dynamic) when the reading selection clearly showed her to be incompetent. My kid who failed these rotten tests is a straight A graduate student, and he’s no smarter now than he was then. I don’t doubt that our education is sub-par, but I am also confident that these tests are an abomination and not true indicators of scholastic competence. The last time I looked at a practice test, a few years ago, it seemed to me the test, in whatever subject area, was mainly a test of computer skills. It was awkward and convoluted to go from the question to the answer and to move from page to page. A child could perfectly comprehend what he was reading and get lost in the computerized format for recording their answers.
Well, they may have more time for Math, English and reading comprehension skills if you remove CRT, ESL, LGTBQ and Drag Queen shows from their classrooms.